
Data Transformation: Is It Reasonable for Exam Scores to Follow a Normal Distribution?(Practical Data Analysis 8)
Discover how data transformation, including normalization techniques like Min-Max, Z-score, and Decimal Scaling, is crucial for accurate analysis and comparison across different data sets.


Welcome to the "Practical Data Analysis" Series

If someone scores 95 on a 100-point exam, you would definitely think they performed well. If they score 65, you would consider their performance poor.
But what if they score 80?
You would think their performance is average because this score is typical for most people in the class.
Why do we have this perception?
It’s because our exam scores from childhood to adulthood usually follow a normal distribution.
What is a normal distribution?
A normal distribution, also known as a Gaussian distribution, refers to the distribution pattern observed in a typical situation. For example, you might ask, "How are the exam scores in the class?"
Here, we're actually referring to the scores of the majority of students.
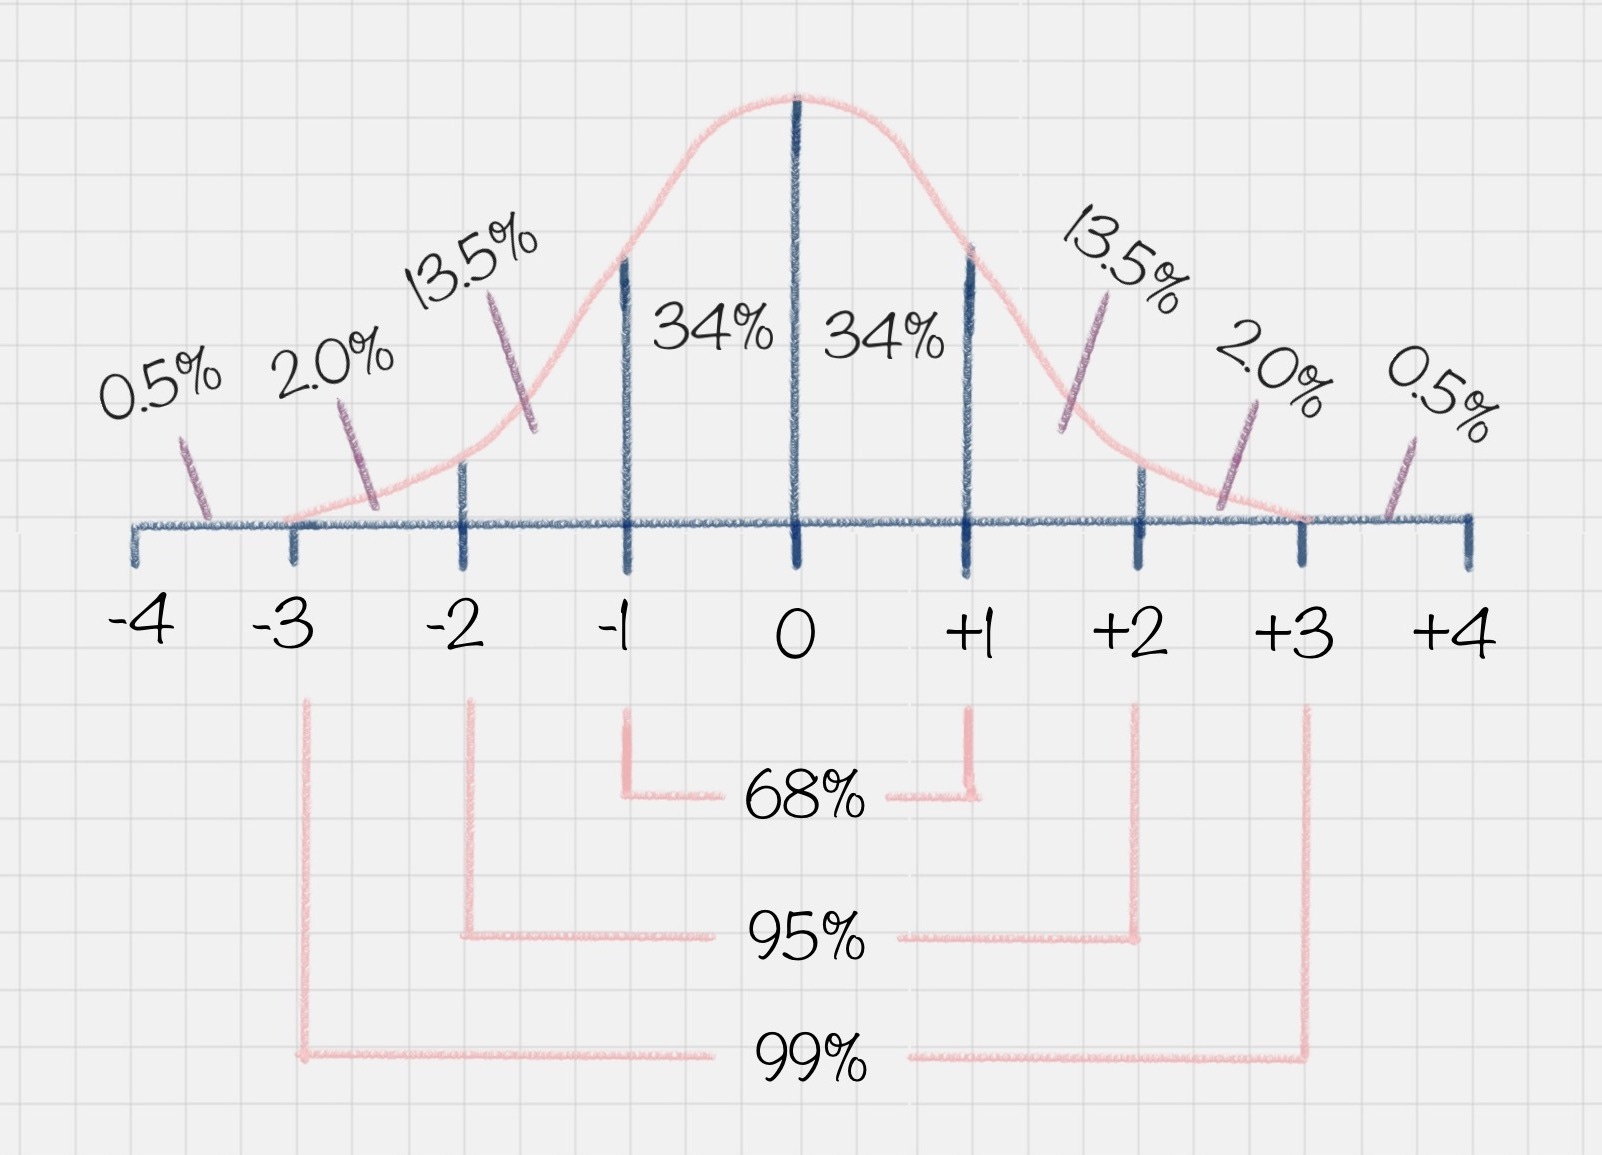
For example, in the diagram below, in a normal distribution, most people's scores are concentrated around the middle region, while only a few people have scores at the extremes.
Another benefit of a normal distribution is that if you know your score and the overall distribution, you can understand your position relative to the rest of the class.
A typical example is the SAT exam scores in the United States, which also follow a normal distribution.
Additionally, for undergraduate admissions in the U.S., Chinese high school students are typically required to have a GPA above 80 (on a 100-point scale), based on the assumption that exam scores follow a normal distribution.
How do teachers ensure exam scores follow a normal distribution?
They typically divide the questions into three categories:
Basic questions, which account for 70% of the total score and are essentially "easy" questions;
Flexible questions, which fall within the basic scope but have some flexibility, accounting for 20%;
Difficult questions, covering a broader range of knowledge, accounting for 10%.
Now, imagine a teacher didn’t follow this pattern and made difficult questions account for 70%, which would be "beyond the syllabus." What would happen?
You’d find that most people’s scores would be “failing.” Eventually, after much discussion, the teacher would normalize the exam scores to make them fit the normal distribution.
Only by doing this can the scores be more comparable. So, a normal distribution of scores not only helps you understand the overall performance of the class but also shows where each person stands within the class.